Wondering why some Southridge listings draw quick offers while others wait? You are not alone. When you understand how inventory, price bands, and days on market work in this Kennewick micro market, you can move with confidence and avoid costly guesswork. In this snapshot, you will see what tends to move fastest in Southridge, why demand looks the way it does, and how to tailor your plan as a buyer or seller. Let’s dive in.
How we define Southridge
We use the Southridge neighborhood as identified in the local MLS neighborhood field and cross‑check with City of Kennewick mapping resources. Because neighborhood labels can differ across sources, we note any boundary differences when we prepare one‑to‑one reports. This keeps your numbers accurate to the streets that matter most to you.
What we track every month
To answer whether Southridge favors buyers or sellers right now, we review a consistent set of metrics over 30, 90, and 365 days.
- Active, new, pending, and closed listings
- Median and average sale price
- Median list price, price per square foot, and list‑to‑sale price ratio
- Median days on market and the percent sold within 7, 14, and 30 days
- Price reductions, concessions, and at‑ or above‑list outcomes
- Months of inventory, using the formula: active listings divided by the recent pace of sales
- Absorption rate, which compares how quickly listings are being purchased
These measures show momentum, help you set strategy, and reduce the risk of overpricing or overbidding.
What’s moving in Southridge
Southridge is known for newer, planned subdivisions and a steady stream of resale and new construction options. In neighborhood data, different price tiers behave differently. Entry and low‑to‑mid tiers usually see faster activity and tighter list‑to‑sale ratios, while upper and luxury tiers typically have longer marketing times and more negotiation room. Small samples can swing the averages in a single month, so we look at 90‑day and 12‑month windows for a clearer read.
Price bands at a glance
We anchor price bands to the Southridge median sale price over the last 12 months:
- Under 75 percent of median, often called entry
- 75 to 100 percent of median, low‑to‑mid
- 100 to 125 percent of median, mid
- 125 to 150 percent of median, upper‑mid
- Over 150 percent of median, upper or luxury
Why this matters: listing strategy, staging choices, and expected time to offer differ by band. What works for a mid‑tier two‑story may not fit a larger, upper‑tier property.
Sales speed and days on market
Median days on market is the cleanest way to see velocity. In most neighborhoods, the entry and low‑to‑mid bands sell faster and often see a higher share of at‑ or above‑list results. As prices climb, average time to offer tends to lengthen, and price reductions become more common. We also look at what percent of sales go pending within 14 and 30 days to understand how quickly buyers must act.
Multiple offers and pricing power
List‑to‑sale price ratio helps set expectations. Ratios near or above 100 percent suggest competitive conditions for that band. Ratios below roughly 98 percent point to more negotiation space. Reading this alongside active inventory tells you whether to expect concessions, repairs, or closing cost credits to help bridge gaps.
Why demand looks the way it does
Several local factors often shape Southridge activity and buyer profiles:
- Employment and commuting. The Tri‑Cities economy includes Hanford operations, Pacific Northwest National Laboratory, regional health systems, agricultural production, and wine. These sectors support steady relocation and move‑up demand.
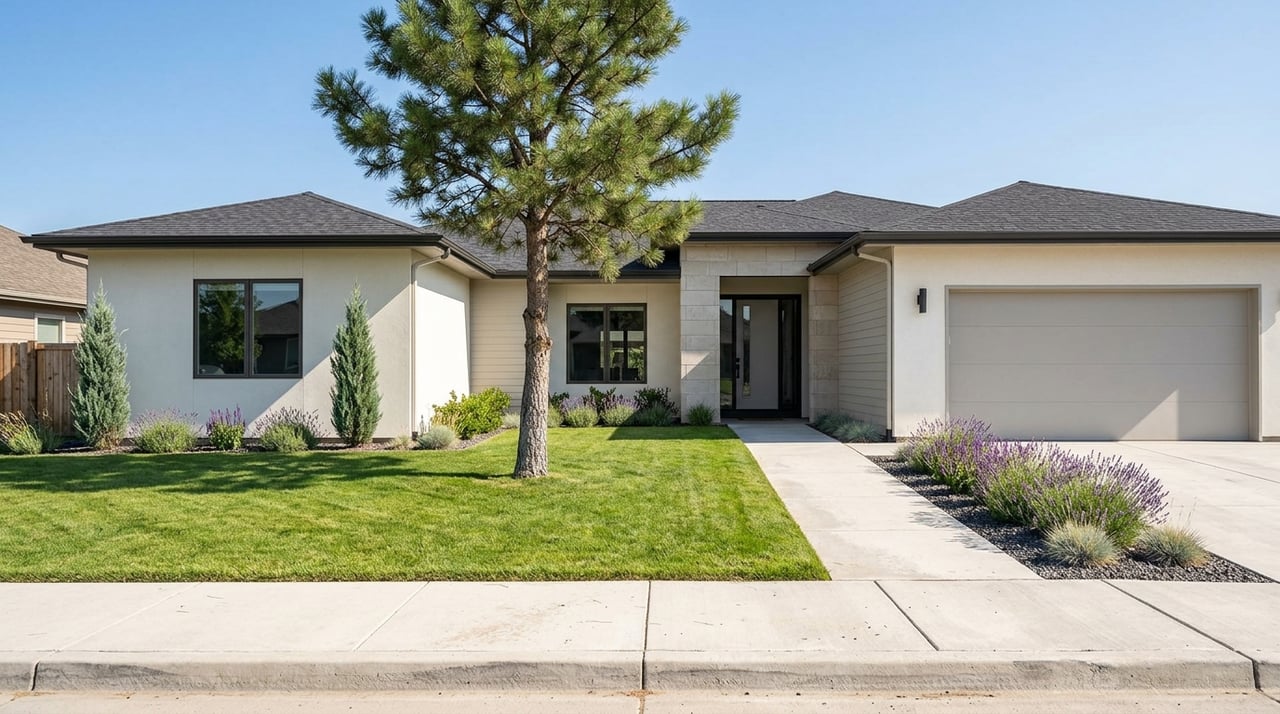
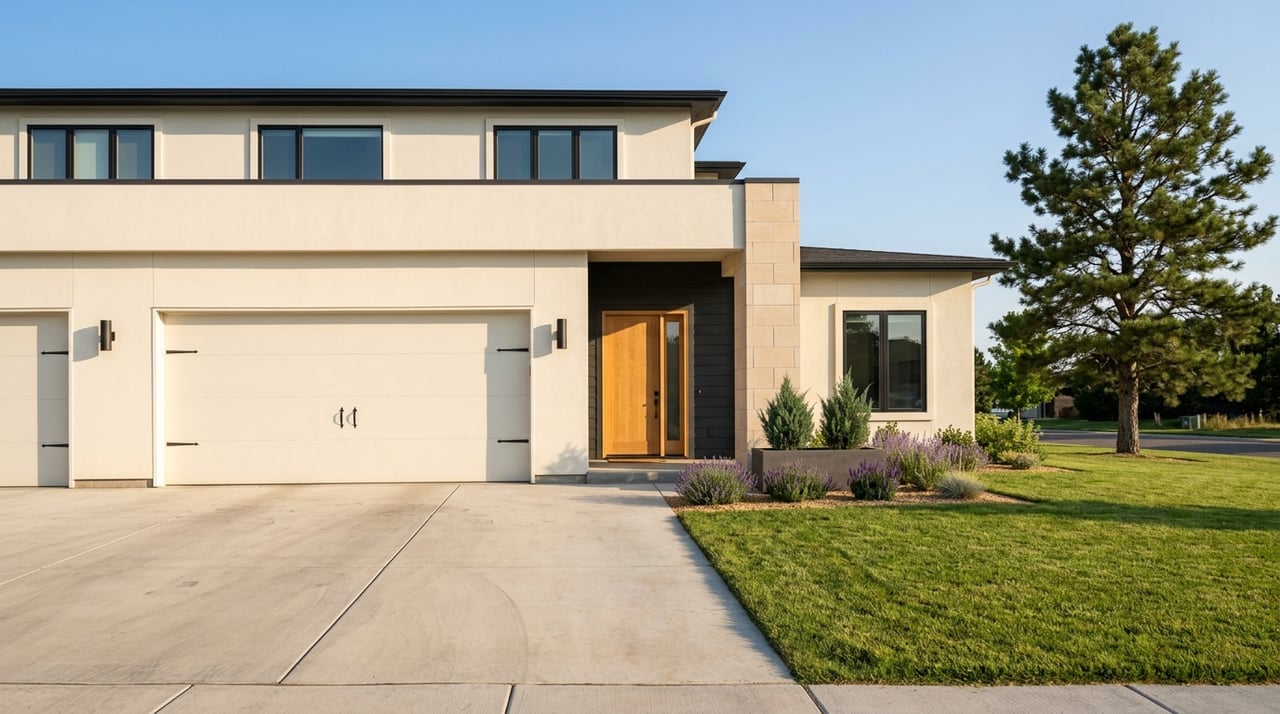
- Newer housing stock. Southridge offers planned subdivisions and newer construction options, which attract buyers seeking modern layouts, energy efficiency, and lower near‑term maintenance.
- Everyday amenities. Proximity to parks, trails, community facilities, shopping, and dining adds convenience for residents who value quick access to services.
- Mortgage rates and affordability. Changes in interest rates directly affect monthly payments. When rates ease, more buyers re‑enter price bands quickly, which can compress days on market.
Together, these drivers help explain why certain price points see quick movement while others take longer to find the right match.
What it means for buyers
You can position yourself to win without overpaying.
- Get fully underwritten pre‑approval before touring. In faster bands, strong documentation shortens timelines and improves your leverage.
- Match your offer timing to the band. Entry and low‑to‑mid homes may require same‑week decisions. Upper‑mid and luxury tiers often allow longer due diligence and more creative terms.
- Use list‑to‑sale ratios as a guide. In tight bands, expect limited discounting. In softer bands, negotiable items like closing costs, rate buydowns, or minor repairs may be on the table.
- Weigh new construction versus resale. Southridge’s newer supply can offer builder incentives or flexible timelines. Resales may deliver established landscaping, window coverings, and quicker occupancy.
If you want a live read on your target band, we can share a 30 and 90‑day snapshot with active‑to‑pending ratios and the latest days on market.
What it means for sellers
Right pricing and a polished presentation protect your net and shorten days on market.
- Price to the band, not just the average. In hot bands, tight pricing near recent comps can generate early traffic and multiple‑offer scenarios. In slower bands, lead with value and a marketing plan that builds confidence.
- Stage for your buyer profile. Newer homes still benefit from light neutral touchups, decluttering, and balanced decor. Fresh photos and video can lift click‑through and showing volume.
- Watch the first two weeks. That is where most serious buyers are watching alerts. If the market does not respond, a precise adjustment can save time and preserve leverage.
- Know your competition. New construction nearby may offer credits or upgrades. Resale listings should highlight strengths new builds do not include, such as mature yards, window treatments, or established community feel.
We review list‑to‑sale ratios, price reductions, and pending velocity before we list, then monitor feedback and traffic in real time to keep your launch on track.
How Southridge compares nearby
Neighborhoods do not always move in lockstep with city or county trends. When we compare Southridge with Kennewick and Benton County, we use the same time windows and metrics. The goal is to see whether months of inventory or days on market are tighter or looser locally. That context helps you decide whether to accelerate your timing, adjust price, or expand your search.
Methodology, timing, and caveats
- Definition. Southridge is defined using the MLS neighborhood field, with boundary checks against City of Kennewick resources. We disclose any variances in one‑to‑one reports.
- Time windows. We track the last 30 and 90 days for momentum, plus the last 12 months for stability. We note sample sizes with each metric.
- Price bands. Bands are set relative to the neighborhood median sale price for the last 12 months. This keeps the analysis current as prices change.
- Interpreting months of inventory. Under about 3 months often signals a seller‑leaning market, 3 to 6 months a balanced market, and over 6 months a buyer‑leaning market.
- Small sample caution. A handful of sales, a single luxury closing, or a cluster of new builds can skew averages. We rely on multiple windows and consistent definitions to keep the story honest.
- Sources. Northwest Multiple Listing Service for listing and sale data. City and county resources for boundaries and permits when needed.
- Last updated. November 2025.
Ready for an up‑to‑the‑minute read on your price band and property type in Southridge? Reach out to Laura & Wes Hodges to receive a custom 30, 90, and 365‑day snapshot, plus a clear plan to buy or sell with confidence.
FAQs
Is Southridge a buyer’s or seller’s market right now?
- We determine this by months of inventory, list‑to‑sale price ratios, and days on market across the last 30 and 90 days, then compare to the 12‑month trend for context.
How fast are homes selling in my price range in Southridge?
- We group recent sales into price bands tied to the neighborhood median, then report median days on market and the percent that go pending within 14 and 30 days.
Should I expect multiple offers on a Southridge listing?
- It depends on your band and condition, since higher list‑to‑sale ratios and low inventory often coincide with multiple offers, while upper tiers may allow more negotiation.
Is inventory in Southridge rising or falling?
- We track active and new listings month by month and compare them with recent closed sales to show direction, seasonality, and how quickly supply is being absorbed.
How does Southridge compare with Kennewick overall?
- We build a side‑by‑side using the same windows and metrics, highlighting any gaps in months of inventory, days on market, and list‑to‑sale price ratios so you can time your move.
What is the best way to get a live snapshot before I list or write an offer?
- Ask for a custom 30, 90, and 365‑day report for your band and property type so you can price, prep, or structure terms with current neighborhood data behind you.